e99 Online Shopping Mall

Geometry.Net - the online learning center Help  
Home  - Science - Statistics (Books)

  Back | 81-100 of 100
A  B  C  D  E  F  G  H  I  J  K  L  M  N  O  P  Q  R  S  T  U  V  W  X  Y  Z  

click price to see details     click image to enlarge     click link to go to the store

$30.99
81. Study Guide and Computer Workbook
$33.14
82. Pdq Statistics (PDQ Series) Third
$131.95
83. Statistics for Business and Economics
$12.74
84. The Manga Guide to Statistics
$25.00
85. The Basic Practice of Statistics
$34.99
86. Business Statistics: Contemporary
$60.00
87. Statistics with STATA: Version
$94.99
88. Statistics for The Behavioral
$120.00
89. Applied Statistics in Business
$85.99
90. Essentials of Statistics for Business
$134.05
91. Applied Statistics and Probability
$49.91
92. Using R for Introductory Statistics
$18.70
93. Reading and Understanding Multivariate
$124.97
94. Complete Business Statistics with
$94.81
95. Computational Handbook of Statistics
$129.77
96. Statistics for Managers using
$139.59
97. Introduction to Probability and
$51.61
98. Probability and Statistics for
$48.19
99. Essentials of Medical Statistics
$11.69
100. MBA Fundamentals Statistics (Kaplan

81. Study Guide and Computer Workbook for Statistics for Psychology
by Arthur Aron
Paperback: 256 Pages (2008-08-09)
list price: US$48.60 -- used & new: US$30.99
(price subject to change: see help)
Asin: 0136043259
Average Customer Review: 3.0 out of 5 stars
Canada | United Kingdom | Germany | France | Japan
Editorial Review

Product Description
A book that focuses on the logic behind the concepts of statistics for psychology, using definitional formulas rather than emphasizing rote memorization. Clearly written, each procedure is conveyed both numerically and verbally, with many visual examples to illustrate the text. It takes the reader from basic procedures through analysis of variance (ANOVA), and not only teaches statistics, but also prepares the user to read and understand research articles as well.This book is an introduction to statistics for psychology, covering such topics as order in a group of numbers; mean, variance, standard deviation, and Z scores; correlation; prediction; the normal curve, probability, and population versus sample; hypothesis testing; the t test; analysis of variance; chi-square tests; the general linear model; and making sense of advanced statistical procedures in research articles.For statisticians, psychologists and those involved in psychological research in the behavioral and social sciences. ... Read more

Customer Reviews (12)

5-0 out of 5 stars Great price, condition & shipping on Textbook!
This seller went above & beyond to make the sale. It's refreshing to buy from someone who takes extra time, communicates & follows through. Thanks so much would purchase again!

1-0 out of 5 stars Avoid this Book
This book is "junk!" It explains statistics in such a way that it will get you more confused, if you are not already. I suggest you get this book, only, if you have a strong understanding of it. But if you don't understand statistic than I suggest you get something else to complement its complexity.

5-0 out of 5 stars Book came quickly; good condition!
The book came about three days after I ordered it; was exactly as described. Great job. THANK YOU!

4-0 out of 5 stars Very Informative
When I learned that Amazon.com had everything I needed I started using it. Especially when going to school and the books are so expective I started ordering my books through Amazon.com and it's been great. For Example, Statistics for Psychology was a huge help for me in class. I paid a great price for it when book stores was asking for $150, with Amazon.com I saved so much money, and the book came on time and it was a great help to have in-front of me when doing my work. This book was very informative and explained everything step by step, I believe if it was not for this book I would have failed my class.

5-0 out of 5 stars Very Good Book
This book is very good and incorporate everything that you need to know about psychology. ... Read more


82. Pdq Statistics (PDQ Series) Third Edition
by Geoffrey R. Norman, David L. Streiner
Paperback: 218 Pages (2003-03-01)
list price: US$41.95 -- used & new: US$33.14
(price subject to change: see help)
Asin: 1550092073
Average Customer Review: 4.5 out of 5 stars
Canada | United Kingdom | Germany | France | Japan
Editorial Review

Product Description
PDQ Statistics, Third Edition offers an expert overview of all major statistical methods, giving the reader a thorough understanding of statistics and how they are used in research articles. The book covers the major categories variable and descriptive statistics, parametric statistics, non-parametric statistics, and multivariate statistics. The explanations are clear, succinct, and loaded with practical examples. This third edition includes new chapters on hierarchical and logistic regression, path analysis, and structural equation modeling. PDQ Statistics, Third Edition also helps the reader identify those statistical analyses with basic flaws in design or research. The book s attractive design and humorous writing style make the subject matter accessible and engaging. ... Read more

Customer Reviews (8)

4-0 out of 5 stars Statistics for the rest of us
A very helpful book, both to read and as a quick reference for those of us who are math impaired. Reccomended to myself by a nursing professor.

5-0 out of 5 stars best statistics book I've known
I have a couple of other fat, authoratative biostats books but PDQ is my reference of choice.If you want to understand biostats, you can't lose with this clever concise text.

3-0 out of 5 stars Not a bad book...
I must begin by stating that I didn't receive the book until the week of my exam. :(So, obviously I was not reliant on it.The book is small enough to be "not so" intimidating.It has relevant formulas and explanations to give one the gist of stats needed to pass a biostats class.

My opinion of the book may have been better had the product arrived sooner.

5-0 out of 5 stars Pdq Statistics (PDQ Series)
In these times, you can't walk in the streets without hear or read some statistics, in the paper, in the market or everywhere.
This is the book not only for a biomedical student, is a book for anyone interested in know what is statistics about. The politicians and doctor can lie with statistics, but with the knowledge from this book, you can see beyond. The use of examples is extensive, and some of them are hilarious. It's a book very concise, informative and, the best of all, funny.

5-0 out of 5 stars In a class of its own!
This book is the only statistics book of its type.For each section covering a specific statistical method (from simple methods to those you may not even cover in your PhD training), a concise 2-5 page summary is presented.The goal is not to enable the reader to calculate any of these statistics, but to understand conceptually what each statistic means.This is where it can fill in information other statistics texts never get to.A student (or researcher!) who can churn out factorial ANOVA results, but doesn't truly understand what they mean can turn to this book for clarity.It's simple (for statistics), it's short, it's clear, and you have to love a book that is dedicated "To the many people who have made this book both possible and necessary -- authors of other statistics books"! ... Read more


83. Statistics for Business and Economics (7th Edition)
by Paul Newbold, William Carlson, Betty Thorne
Hardcover: 1008 Pages (2009-03-23)
list price: US$196.67 -- used & new: US$131.95
(price subject to change: see help)
Asin: 0136085369
Average Customer Review: 3.5 out of 5 stars
Canada | United Kingdom | Germany | France | Japan
Editorial Review

Product Description
For business statistics courses taught in Economics and Business Schools A classic text for accuracy and statistical precision. Statistics for Business and Economics enables students to conduct serious analysis of applied problems rather than running simple "canned" applications. This text is also at a mathematically higher level than most business statistics texts and provides students with the knowledge they need to become stronger analysts for future managerial positions. The seventh edition of this book has been revised and updated to provide students with improved problem contexts for learning how statistical methods can improve their analysis and understanding of business and economics. ... Read more

Customer Reviews (3)

3-0 out of 5 stars Too many typos
Seems like a good book. However one thing that put me off is the number of typos. Almost every chapter has 2 or 3 typos. And not just spelling errors - incorrect formulas and reference to the wrong tables/figures etc. I have never seen so many typos in a test book.
Can be very confusing.
Overall a decent intro to Statistics from a business point of view.

2-0 out of 5 stars worn cover
The condition description is "Good". I paid more for this condition.
Actually, the condition is not what should be defined "Good". It is worn all over the cover and I have to use the tape to fix it.

5-0 out of 5 stars very helpful
This person was very helpful in getting the book shipped to me via UPS as I requested. Thank you so much for your help. ... Read more


84. The Manga Guide to Statistics (Manga Guide To...)
by Shin Takahashi, Trend-Pro Co. Ltd.
Paperback: 224 Pages (2008-10-30)
list price: US$19.95 -- used & new: US$12.74
(price subject to change: see help)
Asin: 1593271891
Average Customer Review: 4.5 out of 5 stars
Canada | United Kingdom | Germany | France | Japan
Editorial Review

Product Description

Think you can't have fun learning statistics? Think again.

The Manga Guide to Statistics will teach you everything you need to know about this essential discipline, while entertaining you at the same time. With its unique combination of Japanese-style comics called manga and serious educational content, the EduManga format is already a hit in Japan.

In The Manga Guide to Statistics, our heroine Rui is determined to learn about statistics to impress the dreamy Mr. Igarashi and begs her father for a tutor. Soon she's spending her Saturdays with geeky, bespectacled Mr. Yamamoto, who patiently teaches her all about the fundamentals of statistics: topics like data categorization, averages, graphing, and standard deviation.

After all her studying, Rui is confident in her knowledge of statistics, including complex concepts like probability, coefficients of correlation, hypothesis tests, and tests of independence. But is it enough to impress her dream guy? Or maybe there's someone better, right in front of her?

Reluctant statistics students of all ages will enjoy learning along with Rui in this charming, easy-to-read guide, which uses real-world examples like teen magazine quizzes, bowling games, test scores, and ramen noodle prices. Examples, exercises, and answer keys help you follow along and check your work. An appendix showing how to perform statistics calculations in Microsoft Excel makes it easy to put Rui's lessons into practice.

This EduManga book is a translation from a bestselling series in Japan, co-published with Ohmsha, Ltd. of Tokyo, Japan.

... Read more

Customer Reviews (23)

3-0 out of 5 stars Pretty tough book that demands repeated readings.
Shin Takahaski, The Manga Guide to Statistics (No Starch Press, 2009)

After being so wowed by The Manga Guide to Databases, I knew I'd be checking out the rest of the series. I decided to start with something I was really interested in learning about (makes sense, huh?), and so came up with The Manga Guide to Statistics. Which turned out to be not as good, but for a completely understandable reason--Takahashi tries to do way, way too much in this volume. The database book is a good high-level overview of the concepts, one that doesn't delve too deep into the technical details of database design and optimization; there's nothing there you wouldn't get in an Intro to Database Design class. The stats book, on the other hand, starts off the same way; I was with him up to probability. I'm a horseplayer and a poker player, so the concept of probability is in no way new to me. I've read more than enough books on handicapping and poker to have learned something like eighty-seven different quick-and-dirty ways of calculating probability (as well as converting it to odds and/or outs, but we won't go there). None of them even begins to approach the detail of the math here... and that's where Takahashi derails this train. There seems to be an understanding that a number of relatively advanced math concepts would already be understood by the reader. That may not be an unreasonable assumption, though I do know that stats was considered "the math class to take to get out of your general ed requirement" at my college. (I was an idiot and went for Calculus I. Twice.) So I've always assumed that stats was the easy method through math, and fifteen years of calculating prices and probabilities hasn't dissuaded me of that notion. A few pages after that halfway point in The Manga Guide to Statistics, though, and I was seeing stars. I'll be digging through it again as time goes on in order to see if I can make heads or tails out of the last half of the book, because it's engaging (if predictable) and related in a likable style, but this isn't one you should pick up and expect to master by the time you've finished your first trip through it. ***

5-0 out of 5 stars Great Book
If you are looking for a quick and fun introduction into statistics, The Manga Guide to Statistics is right up your alley. It introduces and teaches the many of the topics that one would learn about in an introduction to statistics class in a very efficient and entertaining manner, even the equations!Each of the seven chapters explains the material in a cartoon, and concludes with a concise text explanation along with a few practice problems and answers. The Manga Guide to Statistics starts out by introducing the difference between categorical and numerical data, and works the reader up to probability density functions, various correlation techniques, and hypothesis testing. There is even a section on how to use Microsoft Excel to analyze your data for you! Each concept is introduced using real life situations where we are presented data and is used to answer specific questions one may have about said data. This problem based approach makes you want to continue reading and figure out how to answer the question.

3-0 out of 5 stars Mildly entertaining but only average as a statistics text
Ironically for a book that teaches you how to compute median and mean, I found this book only average. It's entertaining, and moves fast, but focuses too much on names and definitions and not on the "why" of the concepts it introduces. For example, in the section on categorizing ramen shops as high priced, medium priced, or low priced, the book teaches you that you can compute the number of categories to use using Sturges Rule, and teaches you how to compute Sturges Rule, then goes on to explain:

"If you try to explain to people that 'this was calculated by a formula called ''SturgesRule," they will only get mad and say 'Who cares about Stur...whatever! why did you set the interval to weird value like 69 yen?'"

So, the whole thing feels like my stereotype of Japanese education, entertaining, teaches you nomenclature and definitions, but weak on why. I learned that when I have a sample with N items in it, I can use Sturges Rule to sort the N items into M categories (where M is the output of Sturges rule), and that this is a reasonable thing to do if you don't have a better way of dividing the sample in categories, but not why Sturges thought his rule was appropriate. And generally, this book is weak on "why".

I'd recommend it if you want a light read, or if you are cramming for an exam, but not if you want it to _ really_ learn statistics.

Question: As Manga, the young tutor character is shown as wearing glasses with concentric circles. In Manga, what does that mean? (The book does explain some Japanese cutltural details, for example, pointing to a specific costume and saying that "Somehow Rui has turned into an elevator girl", but it doesn't explain this one.

2-0 out of 5 stars Much Fun, Too Many Errors
Since I enjoyed the Manga Guide to Statistics, I guess the author achieved at least one objective of good teaching - keep the learner interested. The use of well thought out graphics and humorous examples are likely to encourage a learner to attend to the content.
Still, maintaining interest and good teaching, while related, are not identical. One can maintain interest in ways that detract from learning as well as in ways that enhance learning.
The tendency in this text to oversimplify (e.g., the discussion of what is and is not "measurable" at the beginning of the book, the underemphasis of the importance of random selection) are definite negatives. They will lead a learner with no background in the use of statistical procedures to mistaken conclusions about the meaning of measurements and the generalizability of findings.
In at least one case, the oversimplification proceeds to the point of presenting information that is wrong (i.e., the examples of alternative hypotheses on pp. 172-173). To be fair, there are many "gentle" statistics texts that, as does the Manga Guide to Statistics, present the notion that the alternative hypothesis is simply "not the null hypothesis."
Despite the popularity of this view, Neyman and Pearson (who developed statistical hypothesis testing theory 75 years ago) noted that the "not the null" formulation of the alternative hypothesis would lead to the acceptance of trivial effects as meaningful simply because they were "statistically significant."
The "not the null" formulation of the alternative hypothesis creates other problems.
For example, the null hypothesis on page 173, "The allowances of high school girls in Tokyo and Osaka are the same," has as its alternative, "The allowances of high school girls in Tokyo and Osaka are not the same." Stating the alternative hypothesis in this way does not permit an evaluation of the power of a statistical test (power refers to the probability that a test will detect a difference, change or relationship when it is present). As Neyman noted, since the test would have to detect an infinitesimal difference, the power would necessarily be infinitesimal as well.
Instead, an alternative hypothesis should specify a minimum effect, e.g., "The allowances of high school girls in Tokyo and Osaka differ by an average amount of at least ¥500." By specifying a minimum effect to be detected, we can find the probability that a statistical hypothesis test would detect a difference of at least ¥500 (the test's power).
Since I have to devote time to "unteaching" the "not the null" formulation of the alternative hypothesis, I am far from thrilled to see it here. Convincing learners that the easily understood "not the null" definition is wrong usually requires a lot of work and pain.
After all, who likes being told that what they thought they understood, is what they still do not understand?
This makes it more difficult for me to help my students understand the central importance of power to statistical testing. And, as Neyman pointed out, the power of a test is the main determinant of how useful it is.
It may seem that I am asking too much of an introductory text.
I do not think so.
It is my experience that one must engage in some fairly sophisticated reasoning to understand the meaning of the results of a statistical analysis. The simple, obvious interpretation is almost always wrong (cf., Darrell Huff's How to lie with statistics).
We do a learner no favors by simplifying a complex process to the point where we deceive the learner into thinking that they understand something that they do not.
The trick (which I am still working on mastering) is to help learners learn how to enjoy the challenge of minimizing, but still living with, uncertainty (an important element of all statistical reasoning) and also to help them learn to be suspicious of "easy" answers.
I recently got around to reading W. Edwards Deming's book, Out of the Crisis. In it, he made an observation about maintaining learner interest and quality teaching that is relevant to this book: "In my experience, I have seen a teacher hold a hundred and fifty students spellbound, teaching what is wrong." The Manga Guide to Statistics held my interest from the moment I started reading it. In fact, I read it in one sitting. I honestly enjoyed reading it, but it is wrong in too many places.
I purchased the Manga Guide to Statistics thinking that I might use it in my introductory research methods courses. I shall not use it. I shall not recommend it. I shall not mention it.

Note: I apologize for the lengthy discussion of the alternative hypothesis. I am afraid that I am not clever enough to find another way to demonstrate the problem of oversimplification.

Deming, W.E. (1986). Out of the Crisis. Cambridge, MA: MIT Center for Advanced Engineering Study.

Huff, D. (1954). How to Lie with Statistics. NY: Norton.

Neyman, J. & Pearson, E. (1933). On the problem of the most efficient tests of statistical hypotheses. Philosophical Transactions of the Royal Society of London. Series A, Mathematical and Physical Sciences, 231, 289-337.

5-0 out of 5 stars Surprising Purchase
I bought this book on a whim - I like manga, and statistics play a big part in my daily life. I was expecting this book to suck - how can manga be informative in an academic manner?

To my surprise, it is quite a good book. The topics covered range from high-school statistics (mean, median) to first year uni stats (hypothesis testing).

I'll be one to admit that stats is a dry subject, but Shin Takahashi made it fun (plus it was fun to read the storyline by itself). And yes, I even learnt something (Cramer's V coefficient, which I never needed in my line of work).

My only grouse with it is that it didn't continue further. I was expecting more, but I guess this is why its an intro book.
... Read more


85. The Basic Practice of Statistics w/CD-ROM
by David S. Moore
Hardcover: 728 Pages (2006-08-04)
-- used & new: US$25.00
(price subject to change: see help)
Asin: 071677478X
Average Customer Review: 3.5 out of 5 stars
Canada | United Kingdom | Germany | France | Japan
Editorial Review

Product Description

In the #1 bestselling brief text, The Basic Practice of Statistics (BPS), Moore brings the data analysis approach to the one-term course, with an accessible, fun style that helps students with limited mathematical backgrounds utilize the same tools, techniques, and interpretive skills working statisticians rely on everyday.
 
This extraordinary new edition of Moore's classic offers a number of innovations, including briefer chapters, a new problem-solving process, a wealth of new exercises, and new all-in-one place StatsPortal, with all the electronic tools instructors and students need.
... Read more

Customer Reviews (13)

4-0 out of 5 stars speedy delivery good condition
The accompanying CD was broken but that likely just happened in the mail. Otherwise the book is in great condition. I am very satisfied. Would order from this seller again.

3-0 out of 5 stars Still a good value
While the book was in good condition, it was obviously not "new" as advertised (the book had a used bookstore sticker on the side of it). However, I would have still purchased the book for the price had I seen the book before hand.

4-0 out of 5 stars totally satisfied
the book condition is good. and cd was also there in the book, which actually i did not expect. the quality of the book is really good, i have admire that. otherwise the review of this book will be incomplete. so i am very happy and satisfied customer. thanks

4-0 out of 5 stars The Basic Practice of Statistics
This book is very organized when it comes to laying out material. There is no guessing or play on words within questions or definitions, just straight and to the point. It's nice to see that there is an answer key and a detailed index, for there have been math textbooks I have ran across that did not have both these features. For those who have to struggle through a 100 series stats course, I recommend this textbook. It's quite foolproof and easy to comprehend, plus it is worth keeping as a refresher for continuing academic studies regardless of one's field.

5-0 out of 5 stars Great product
oh the product is exactly what I expected to receive. In a top notch condition and I am very pleased with the price that I had to pay. Thank you so much for such a great transaction. ... Read more


86. Business Statistics: Contemporary Decision Making
by Ken Black
Hardcover: 880 Pages (2007-01-22)
-- used & new: US$34.99
(price subject to change: see help)
Asin: 0471789569
Average Customer Review: 4.0 out of 5 stars
Canada | United Kingdom | Germany | France | Japan
Editorial Review

Product Description
Help your students see the light.

With its myriad of techniques, concepts and formulas, business statistics can be overwhelming for many students. They can have trouble recognizing the importance of studying statistics, and making connections between concepts.

Ken Black's fifth edition of Business Statistics: For Contemporary Decision Making helps students see the big picture of the business statistics course by giving clearer paths to learn and choose the right techniques.

Here's how Ken Black helps students see the big picture:

  • Video Tutorials-In these video clips, Ken Black provides students with extra learning assistance on key difficult topics. Available in WileyPLUS.
  • Tree Taxonomy Diagram-Tree Taxonomy Diagram for Unit 3 further illustrates the connection between topics and helps students pick the correct technique to use to solve problems.
  • New Organization-The Fifth Edition is reorganized into four units, which will help professor teach and students see the connection between topics.

WileyPLUS-WilePLUS provides everything needed to create an environment where students can reach their full potential and experience the exhilaration of academic success. In addition to a complete online text, online homework, and instant feedback, WileyPLUS offers additional Practice Problems that give students the opportunity to apply their knowledge, and Decision Dilemma Interactive Cases that provide real-world decision-making scenarios.
Learn more at www.wiley.co,/college/wileyplus. ... Read more

Customer Reviews (4)

2-0 out of 5 stars Buy the 5th edition, and save money!
I am in an MBA program that required the new (6th) edition of this book for my course.They wanted $189+ tax for it at my local university bookstore, and (being a savvy business student) I used the power of supply and demand to save money by buying the 5th edition.After working with fellow students that purchased the 6th edition with the included disk (which I'll get to in a moment), I haven't noticed any major differences.With that being said, I can't speak to the order of sample problems.We do not do problems out of the book, so they might be slightly renumbered between editions (though I doubt it).The chapters and content layout seem to be nearly identical, and the concepts are essentially the same. I find this text very difficult to follow, and poorly written.I don't tend to understand what I read until my professor presents the material in class.After seeing my professor use various diagrams and simplified equations in class, I can't figure out why the author didn't use them as well.The bottom line is that this book is not "easy" to learn from, and you probably won't enjoy cracking it open after lecture.It does contain the necessary formulas and content to build skills, but they are not presented very well.

A word about the disk-
My book did not include the disk that is supposed to supplement the text, so this is only what I have been told by other students.They said that the disk is worthless, and that you have to pay additional money to access anything of use on it.I would save your money, and seek free info from online resources.I have bought books in the past with disks, and they never seemed to help me much.

5-0 out of 5 stars Stats!
The book is well written. The author kept the narration relevant to issues the business manager faces today.The sample problems are very instructive. There are inputs at the end of each chapter of how to use Excel and Minitab to solve the problems. I struggled with Stats in Undergrad. Ready now for the MBA class!!! Bring it on!!

5-0 out of 5 stars Business Statistics Review
Very good book for business majors taking a statistics class.Statistics is not easy to understand, but this book tries to make it as painless as possible.The flow is easy to follow and the examples make it all the more understandable.

3-0 out of 5 stars Business Statistics: For Contemporary Decision Making
Good economics book. Could use more real-world examples.
The book arrived in good condition but did not include the CD that would have been there had I purchased it from a brick and mortar book store. ... Read more


87. Statistics with STATA: Version 10
by Lawrence C. Hamilton
Paperback: 400 Pages (2008-10-16)
list price: US$97.95 -- used & new: US$60.00
(price subject to change: see help)
Asin: 0495557862
Average Customer Review: 5.0 out of 5 stars
Canada | United Kingdom | Germany | France | Japan
Editorial Review

Product Description
For professional researchers and casual readers alike, STATISTICS WITH STATA opens the door to the full use of the popular Stata program?a fast, flexible, and easy-to-use environment for data management and statistics analysis. Now integrating Stata's impressive new graphics, this comprehensive book presents hundreds of examples showing how you can apply Stata to accomplish a wide variety of tasks. Like Stata itself, STATISTICS WITH STATA will make it easier for you to move fluidly through the world of modern data analysis. ... Read more

Customer Reviews (1)

5-0 out of 5 stars Statistics with STATA: Version 10
Very helpful book especially when going from SPSS to Stata. Before this book, I had no idea how powerful Stata is compared to SPSS. ... Read more


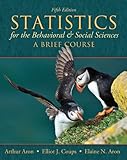
88. Statistics for The Behavioral and Social Sciences (5th Edition)
by Arthur Aron, Elaine N. Aron, Elliot Coups
Paperback: 504 Pages (2010-07-10)
list price: US$127.40 -- used & new: US$94.99
(price subject to change: see help)
Asin: 0205797253
Average Customer Review: 4.0 out of 5 stars
Canada | United Kingdom | Germany | France | Japan
Editorial Review

Product Description

For one-quarter/semester courses that focus on the basics in statistics or combine statistics with research methods.


The fifth edition of Statistics for the Behavioral and Social Sciences builds off an already well-established approach - emphasizing the intuitive, deemphasizing the mathematical, and explaining everything in direct, simple language - but also goes beyond these principles to further student understanding. By using definitional formulas to emphasize the concepts of statistics, rather than rote memorization, students work problems in a way that keeps them constantly aware of the underlying logic of what they are doing. 

... Read more

Customer Reviews (8)

1-0 out of 5 stars Dissatisfied buyer
i was under the impression, from the 2 day shipping advertisement, that my order would be shipped expeditiously. it was all for show and to trap the customer, b/c its been 2weeks and i still dont have my book order which make me 2 weeks behind in studies. the book was less expensive than the book store, but now i know its not worth the wait.

5-0 out of 5 stars Statistics for the Behavioral and Social Sciences (4th Edition)
I was very happy with my order of this particular book.Amazon provided the lowest cost out of all of the other websites I searched.The book was received in a matter of days; which was when I needed it.And the quality of the book was new; thus, the book was in excellent shape.I would definitely recommend other consumers to consider purchasing this and other books directly from Amazon.

5-0 out of 5 stars Statistics
Book was exactly what I needed for class - fast response and turn-around time.Thank you.

5-0 out of 5 stars as promised
This book can in in plenty of time for my online class.It was as promised...new condition, no markings.

5-0 out of 5 stars Statistics for the Behavioral and Social Sciences (4th ed.)

Book arrived promptly and in stated condition. I would buy from this seller again. ... Read more


89. Applied Statistics in Business and Economics with St CDRom
by David Doane, Lori Seward
Hardcover: 834 Pages (2006-01-19)
-- used & new: US$120.00
(price subject to change: see help)
Asin: 0073215759
Average Customer Review: 4.0 out of 5 stars
Canada | United Kingdom | Germany | France | Japan
Editorial Review

Product Description
This new text offers an Excel focused approach to using statistics in business. All statistical concepts are illustrated with applied examples immediately upon introduction. Modern computing tools and applications are introduced, and the text maintains a strong focus on presenting statistical concepts as applied in business --as opposed to providing programming methods used to find a mathematical solution.Interpretation is heavily emphasized, enabling students to take full advantage of Excel to develop and drive problem-solving skills. ... Read more

Customer Reviews (5)

5-0 out of 5 stars Applied Statistics
This is a very informative and useful text. The CDRom was a pleasant suprise with everything you could want just a click away. I viewed the book online, but I prefer to have the actual book in hand. When I received the book, I was encouraged to sit down and read it even more. This is a must have for anyone who wants to learn about statistics.

5-0 out of 5 stars good condition
This book was in very good condition with very little writing and no high lighting! It also contained the cd's that came w/ the book which was great.

4-0 out of 5 stars quick delivery, condition exactly as described
This book arrived quickly (within one week, standard shipping) and the seller informed me through mail when the product had been shipped.I found that very helpful.THe condition of the book was also very good,but there was some writing/markings on some of the pages.However, it wasn't enough that I was distracted or bothered by it.

3-0 out of 5 stars Decision Science
My Prof really likes this book and has used previous editions too.My opinion - so far so good. In my limited review of the book the examples are good and the language is not technical.This course/book is part of my graduate studies in biology.The book is primarily business focused but with a profs help it is totally applicable to scientific data evaluation.Otherwise, it is approaching week 4 of 12 in my class and we haven't really relied on the book. My only real comment is to check with your campus bookstore/professor and see if it is supposed to come with a student version of Minitab (the software associated with the text).My online order did not come with Minitab, which I need for my stats course.

4-0 out of 5 stars Good buy
Purchased this book used not new, for $73.99 from a private dealer on Amazon. I would have to say that the text is easy to understand, lots of material (lots) included and covered, the CD included is quite helpful as well, since it provides chapter highlights in PowerPoint, practice quizzes and homeworks, tutorials and samples for Excel, and the "MegaStat" add-on for the Excel program, which enables users to fully utilize Excel's ability to perform statistical calculations. Good purchase overall at the used purchase price, not sure if the case would be the same at the retail price, just make sure that the text includes the CD. ... Read more


90. Essentials of Statistics for Business and Economics (with CD-ROM)
by David R. Anderson, Dennis J. Sweeney, Thomas A. Williams
Hardcover: 672 Pages (2008-01-03)
list price: US$207.95 -- used & new: US$85.99
(price subject to change: see help)
Asin: 0324568606
Average Customer Review: 4.5 out of 5 stars
Canada | United Kingdom | Germany | France | Japan
Editorial Review

Product Description
Trust the latest version of this market-leading essentials text to introduce sound statistical methodology in a proven applications setting. ESSENTIALS OF STATISTICS FOR BUSINESS AND ECONOMICS, 5e, includes all of the strengths of the longer best-selling Anderson/Sweeney/Williams STATISTICS FOR BUSINESS AND ECONOMICS, with a focus on the most important core topics for a concise presentation that's easy for students to follow. This brief introduction to business statistics offers a wealth of actual business examples, proven methods, and application exercises that clearly demonstrate how statistical results provide insights into business decisions and present solutions to contemporary business problems. High-quality problems, trusted for their unwavering accuracy, and the authors' signature problem-scenario approach clearly show how to apply statistical methods in practical business situations. New case problems as well as methods, applications, and self-test exercises encourage students to master formulas, apply materials, and evaluate their personal understanding.Optional updated appendices highlight the latest Excel? 2007 and Minitab? 15 popular commercial software, giving you the choice of integrating or omitting computer coverage in your course. This edition's concise approach and comprehensive support package, now including CengageNOW course management system, provides everything you need for an effective statistics course that prepares students for the essentials of statistics success in business today. ... Read more

Customer Reviews (12)

5-0 out of 5 stars Super fast shipping!!!!!
Ordered friday the 21st he shipped it on saturday and i received it on monday. What makes it unbelievable is that i live all the way in new hampshire and this book came from california. Book was exactly as described and in perfect condition. Best person i have ever bought a textbook from off of amazon.

4-0 out of 5 stars Statistic book
The book came within 2 days and looks like new!! I am very happy with this purchase. I intend to buy more of my text books from Amazon.com.

5-0 out of 5 stars Excellent Experience and would buy from distributor again.
I received the book sooner than expected in the excellent description provided. The book was in "New" condition...

5-0 out of 5 stars Essentials of Statistics for Business and Economics
Great Text! I purchased this for a graduate level statistics course, and I had concerns because its been 30 years since I cracked a statistics text. It starts with the basics and build quickly to more advanced work. Perfect for my needs.

1-0 out of 5 stars Advertised as new...no CD
It did say in the fine print, "Missing CD", but I didn't read the fine print - the book was advertised as "New".Not, "Like new", but "New".I contacted the seller, he did nothing.Not even any concern.I will not buy from him again. ... Read more


91. Applied Statistics and Probability for Engineers
by Douglas C. Montgomery, George C. Runger
Hardcover: 784 Pages (2010-03-23)
-- used & new: US$134.05
(price subject to change: see help)
Asin: 0470053046
Average Customer Review: 3.5 out of 5 stars
Canada | United Kingdom | Germany | France | Japan
Editorial Review

Product Description
Montgomery and Runger's bestselling engineering statistics text provides a practical approach oriented to engineering as well as chemical and physical sciences. By providing unique problem sets that reflect realistic situations, students learn how the material will be relevant in their careers. With a focus on how statistical tools are integrated into the engineering problem-solving process, all major aspects of engineering statistics are covered. Developed with sponsorship from the National Science Foundation, this text incorporates many insights from the authors' teaching experience along with feedback from numerous adopters of previous editions. ... Read more

Customer Reviews (29)

5-0 out of 5 stars Excellent and broad scope of work
I'm already a Mechanical Engineer with a Computer Science second degree. This work is in-depth and covers a broad spectrum for one to apply to their chosen vocations, even if it's just a portion of the design process in your field(s).

What I'm tired of reading is all the whining about this book having errors.

That's the job of the typesetter and editing staff to coordinate with the author to make sure they catch these errors before final printing.

Best of luck finding any work of fiction or non-fiction free of errors.

What I expected I also got. I expected a quality book. I expected to visit Wiley's web site which sent me to a companion web site to find the Errata, Solutions Errata and Data sets to the work. I got all of them.

Get off your duffs and add this to your following through and absorbing this broad and deep work.

This is a first rate book in it's area. Two thumbs up.

5-0 out of 5 stars Great transaction!
I was surprised that the item arrived between 3-5 days after I ordered it! Thanks for a great service! The book arrived in excellent condition too!

4-0 out of 5 stars It is good but has some mistake
Bcz it is my textbook, so I read it carefully. And I found that there are some mistakes here. When u learn this subject. U always have to check the value from the tables and charts in the back of the book. And u must check it carefully, bcz the text will miss leading you sometimes. Just take the equation 9-25 as an example, you should check the charts VIIG and VIIH, but not the VIG and VIH. Beside this kind of misstake, everything is fine

4-0 out of 5 stars Statistics review
This text book had easy to understand formulas.Some short cuts were taken in the examples so if you have forgotten all your math tips, you may have to try twice to complete the problem.But this saves much needed space.The sample problems involved engineering problems, so it was easier to see relevance. I would skip the first chapter.

5-0 out of 5 stars great.
Great price, good quality; it would be great if Beat the Bookstore sold used books such as this AT this price IN their store so that I don't have to get something shipped to my place when I can just walk over to the Old Cap. Mall... ... Read more


92. Using R for Introductory Statistics
by John Verzani
Hardcover: 432 Pages (2004-11-29)
list price: US$53.95 -- used & new: US$49.91
(price subject to change: see help)
Asin: 1584884509
Average Customer Review: 4.5 out of 5 stars
Canada | United Kingdom | Germany | France | Japan
Editorial Review

Product Description
The cost of statistical computing software has precluded many universities from installing these valuable computational and analytical tools. R, a powerful open-source software package, was created in response to this issue. It has enjoyed explosive growth since its introduction, owing to its coherence, flexibility, and free availability. While it is a valuable tool for students who are first learning statistics, proper introductory materials are needed for its adoption.

Using R for Introductory Statistics fills this gap in the literature, making the software accessible to the introductory student. The author presents a self-contained treatment of statistical topics and the intricacies of the R software. The pacing is such that students are able to master data manipulation and exploration before diving into more advanced statistical concepts. The book treats exploratory data analysis with more attention than is typical, includes a chapter on simulation, and provides a unified approach to linear models.

This text lays the foundation for further study and development in statistics using R. Appendices cover installation, graphical user interfaces, and teaching with R, as well as information on writing functions and producing graphics. This is an ideal text for integrating the study of statistics with a powerful computational tool. ... Read more

Customer Reviews (7)

5-0 out of 5 stars well organized and helpful
I used this book for a statistics class when I had no previous experience using R. I found this to be a great resource and well organized. If you are in my boat and need to catch up on R, check this out!

5-0 out of 5 stars Great intro book for R
This is a great book for learning how to practice intro statistics for R.
If you consider this is a stats book, you will not be satisfied.
You need a stats textbook with this to learn stats.
If you know general things about stats, this book is the best intro for R as a statistical tool.

I also own Introductory Statistics with R by Peter Delgaard.
I recommend to read Using R first then proceed to Delgaard's book.
In this fashion, you will get a brief review of what you learn from Using R and will build up more introductory to intermediate techniques.

If you finish the two books, you are ready to explore any other R and S-Plus books.

5-0 out of 5 stars Very complete introduction to statistics and GNU R
This is the perfect book if you are looking for a self-contained, practical introduction to statistics using GNU R.

It contains a lot of examples and exercises for reinforcing the contents. Very clear and organized presentation of topics. It assumes no previous background on statistics at all, and could be used as a complementary text for lab sessions.

It both explains GNU R commands and data types and provides a basic introduction to statistics theory, from a practical point of view. The last one, of course, may also be enhanced by your favorite book for introductory statistics, though it is not absolutely necessary to use this book.

2-0 out of 5 stars Poorly organized and frustrating
In an introductory book, it is really important to present concepts in order. This book fails on this count. On more than one occasion, a concept (e.g., "trimmed mean") or a function (e.g., "range(x)") is mentioned without being defined, only to be presented as new later on. This is very frustrating and prevents a new student from working through the book fast. As some other reviewers remarked, the index is a complete disaster, which only makes this worse. It is nice that the book comes with a package of problems. The package lacks answers to most of these problems, though, so one can't check progress easily.

Look elsewhere.

5-0 out of 5 stars best overall introduction to statistics using R
This book is an excellent introduction to basic statistics, not assuming a knowledge of calculus, using an intuitive "hands-on approach" using the free computer program R.Statistics should be learned with the fingers on a computer, not merely by memorizing formulas, so you do well to learn statistics with a book in one hand, sitting in front of a computer.John Verzani gives a gentle introduction to statistics using R.

For those unaware, R is a complete, very powerful statistics program that was developed in the 1990s based on an early language called S/Splus, created by John Chambers in the 1970s.S/Splus is an extremely powerful language for doing statistics / numerical research, and was developed explicitly for that purpose.It is far stronger than Matlab for statistical data analysis.R has a vibrant online community with hundreds of free add-on packages (available from the CRAN website).R has grown to be much more powerful than SPSS or SAS in recent years, and is becoming the tool of choice by the experts in the field.It's suitable for beginners too, but doesn't have the point and click style of simpler programs.

There are three main books that are introductions to R.One by Verzani (reviewed here), one by Dalgaard, and one by Crawley.Of the three, I find this one to be the best.It is the most clearly organized and has the best logical presentation of the three.It goes into the right amount of depth without getting bogged down.You can work through all the exercises in the book because the datasets are freely downloadable from the web.

Be sure to do as many of the exercises in the book as you can -- that will really help you to learn statistics well! ... Read more


93. Reading and Understanding Multivariate Statistics
by Laurence G. Grimm
Paperback: 373 Pages (1995-01)
list price: US$29.95 -- used & new: US$18.70
(price subject to change: see help)
Asin: 1557982732
Average Customer Review: 4.5 out of 5 stars
Canada | United Kingdom | Germany | France | Japan
Editorial Review

Product Description
The book presents an overview of multivariate statistics and their place in research. It describes the appropriate context for -- and the types of empirical questions that can best be addressed by -- each technique or family of techniques, as well as the distribution assumptions that must be met for the analysis to be meaningful. The most commonly used multivariate techniques are examined in detail: multiple regression and correlation, path analysis, principal-components analysis, exploratory and confirmatory factor analysis, multidimensional scaling, analysis of cross-classified data, logistic regression, multivariate an alysis of variance (MANOVA), discriminant analysis, and meta-analysis. Statistical notations are explained, underlying assumptions are described, and terms are defined clearly and understandably. Concepts and symbols are presented with minimal use of formulas and a generous use of real-world research examples. Each chapter also includes suggestions for additional reading and a glossary of statistical and related terms. ... Read more

Customer Reviews (9)

4-0 out of 5 stars Good but uneven introduction
This is a fairly good introduction. Its main drawback is the uneveness of the presentation. This is due to the fact that 12 authors contribute to the book's 10 chapters. For a helpful preliminary, I suggest Kachigan's more conceptual and integrated book, especially if you need a refresher on basic statistical concepts.

4-0 out of 5 stars Excellent high-level overview
This book is an excellent high-level overview of multivariate statistics and the techniques for working with multivariate data.

It doesn't go into detail making it a very good read for people wanting to learn multivariate concepts.

4-0 out of 5 stars Reading and Understanding Multivariate Statistics by Grimm
A good resource for someone taking a psyc stat class.

5-0 out of 5 stars Fantastic Treatment of Sophisticated Mathemeatical Concepts
I've long wanted a better explanation of Eigenvectors and Eigenvalues than I recieved in a econometrics or statistics textbook. This book gives me an incredibly clear understanding of what they are. Now when I look back at the mathematical interpretation again it means so much more. This is a fantastic book that would highly recommend to anyone wanting a clear conceptual understanding of these sophisticated topics. 5 stars, no questions about it!

5-0 out of 5 stars Great Resource for Statistics
In many introductory statistics courses you usually do not cover multivariate statistics. This book and its companion volume are useful for anyone in upper level undergraduate or graduate programs. It is a great reference to have when planning research.

You can read it all at once to get a general understanding of this area or you can look at it as you need it as a reference. It was much better than the statistics books I have had as required reading in courses. It's a great resource overall! ... Read more


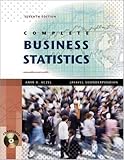
94. Complete Business Statistics with Student CD (The Mcgraw-Hill/Irwin Series)
by Amir Aczel, Jayavel Sounderpandian
Hardcover: 804 Pages (2008-02-08)
-- used & new: US$124.97
(price subject to change: see help)
Asin: 0077239695
Average Customer Review: 3.5 out of 5 stars
Canada | United Kingdom | Germany | France | Japan
Editorial Review

Product Description
Statistical integrity with a complete Excel solution.The seventh edition retains its global emphasis, maintaining its position of being at the vanguard of international issues in business. ... Read more

Customer Reviews (10)

5-0 out of 5 stars No complaints
This book has everything you need for class. It can get a little heavy on the jargon at times, but that is only a mark of its comprehensiveness. I haven't even used the CD.

4-0 out of 5 stars book delivery
thankyou for the book, ordered on 1st and arrived on 9th. In good shape and in 1 piece.

3-0 out of 5 stars good book
very good book used for both of my classes... managerial statistics and operations research methods

5-0 out of 5 stars No complaints!
The seller kept in constant contact with me. They let me know when the book got shipped out and provided me with a tracking number as well. Very satisfied!

4-0 out of 5 stars Excellent Stats Book
I use this book in doctoral courses I teach in business statistics.

Besides its excellent coverage of the basic concepts of descriptive and inferential statistics, its use of spreadsheet technology provides students with a means of solving problems with the aid of their personal computers, both during the course and later in the work place.

Of the many texts I have used in teaching statistics at the undergraduate and graduate level, this one is the best.

Robert E. Levasseur, Ph.D., author of "Practical Statistics"
... Read more


95. Computational Handbook of Statistics (4th Edition)
by James L. Bruning, B. L. Kintz
Paperback: 352 Pages (1997-01-17)
list price: US$95.80 -- used & new: US$94.81
(price subject to change: see help)
Asin: 0673990850
Average Customer Review: 5.0 out of 5 stars
Canada | United Kingdom | Germany | France | Japan
Editorial Review

Product Description
Emphasis is on the theory and assumptions, the logic, and the derivations and formulas of the various statistical tests. Paper. DLC: Social sciences - Statistical methods. ... Read more

Customer Reviews (6)

5-0 out of 5 stars Well worth it
This is a fantastic book and I highly, highly recommend it. The step by step approach is simple, and well explained. This book has helped me considerably more than other statistics text books I own and if you are having trouble it is well worth the buy.

5-0 out of 5 stars So helpful we once owned an upstairs and downstairs copy
What is the best way to learn and be secure in your learning -- work a problem through with expert guidance. This book provides clear advice about what statistics to choose for what problem and then provides small data sets. You can confirm your capability by working the problem step-by-step with the authors -- that includes understanding the meaning of your result and drawing an appropriate conclusion. Students love it. Me, too.

5-0 out of 5 stars A true friend
I also used the first edition of this book. Several copies of it in fact. The first two editions were true handbooks that were never out of reach from my desk (unless "borrowed") for over thirty years.I cannotrecommend this book too highly to anyone who will be using statistics.Mayit be as true a friend to you as it was to me.

(But did the price have toincrease so drasticly?)

5-0 out of 5 stars A fabulous cookbook
I cut my teeth in statistics with the first edition of this book in 1968, back before we had computer programs to do our statistics for us.And I have kept the second edition on my shelf since 1977.The book leads the reader step by step through the hand calculations for all the basicstatistics, and for some relatively obscure ones as well (such as tests ofthe difference between two correlations or between two proportions).Thesedays, students of statistics go right to their keyboards, and thestatistics come out a millisecond or two later.But if you want yourstudents to see how these things are actually calculated, there is nobetter reference than this.

5-0 out of 5 stars A fabulous cookbook
I cut my teeth in statistics with the first edition of this book in 1968, back before we had computer programs to do our statistics for us.And I have kept the second edition on my shelf since 1977.The book leads the reader step by step through the hand calculations for all the basicstatistics, and for some relatively obscure ones as well (such as tests ofthe difference between two correlations or between two proportions).Thesedays, students of statistics go right to their keyboards, and thestatistics come out a millisecond or two later.But if you want yourstudents to see how these things are actually calculated, there is nobetter reference than this. ... Read more


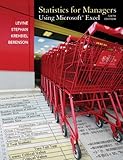
96. Statistics for Managers using MS Excel (6th Edition) (MyStatLab Series)
by David M. Levine, Mark L. Berenson, Timothy C. Krehbiel, David F. Stephan
Hardcover: 840 Pages (2010-02-22)
list price: US$180.00 -- used & new: US$129.77
(price subject to change: see help)
Asin: 0137035195
Average Customer Review: 3.0 out of 5 stars
Canada | United Kingdom | Germany | France | Japan
Editorial Review

Product Description
Reducing the emphasis on doing computations, this practical text thoroughly integrates Microsoft® Excel as a tool for analysis and presents statistical concepts in the context of the functional areas of business.

Introduction; Organizing and Visualizing Data; Descriptive Statistics; Basic Probability; Discrete Probability Distributions; The Normal Distribution and Other Continuous Distributions; Sampling and Sampling Distributions; Confidence Interval Estimation; Fundamentals of Hypothesis Testing: One-Sample Tests; Two-Sample Tests; Analysis of Variance; Chi-Square Tests and Non-Parametric Tests; Simple Linear Regression; Introduction to Multiple Regression; Multiple Regression Model Building; Time-Series Forecasting; Statistical Applications in Quality Management; Data Analysis Overview; Online Topic: Decision Making

For professionals, particularly managers, making financial analyses and decisions.

... Read more

Customer Reviews (1)

3-0 out of 5 stars So, so
I'm fairly pleased with the textbook but, it didn't come with any cds.I was under the impression that it was suppose to come with a Microsoft Excel cd.I ordered a new textbook but, it didn't look new.But I was still pleased with the condition of the textbook.Although it arrived within the time frame specified, I thought it took too long getting to me. ... Read more


97. Introduction to Probability and Statistics
by William Mendenhall, RobertJ. Beaver, BarbaraM. Beaver
Hardcover: 784 Pages (2008-02-11)
list price: US$183.95 -- used & new: US$139.59
(price subject to change: see help)
Asin: 0495389536
Average Customer Review: 2.5 out of 5 stars
Canada | United Kingdom | Germany | France | Japan
Editorial Review

Product Description
Used by hundreds of thousands of students, market-leading INTRODUCTION TO PROBABILITY AND STATISTICS, Thirteenth Edition, blends proven coverage with new innovations to ensure you gain a solid understanding of statistical concepts--and see their relevance to your everyday life. The new thirteenth edition retains the text?s straightforward presentation and traditional outline for descriptive and inferential statistics while incorporating modern technology--including computational software and interactive visual tools--to help you master statistical reasoning and skillfully interpret statistical results. Exciting learning tools like MyPersonal Trainer, MyApplet, and MyTip ensure that you thoroughly understand chapter material and give you hands-on experience putting it into action. Drawing from decades of classroom teaching experience, the authors clearly illustrate how to apply statistical procedures as they explain how to describe real sets of data, what statistical tests mean in terms of practical application, how to evaluate the validity of the assumptions behind statistical tests, and what to do when statistical assumptions have been violated. Statistics can be an intimidating course, but with this text you will be well prepared. With its thorough explanations, insightful examples, practical exercises, and innovative technology features, INTRODUCTION TO PROBABILITY AND STATISTICS, Thirteenth Edition, equips you with a firm foundation in statistical concepts, as well as the tools to apply them to the world around you. ... Read more

Customer Reviews (17)

5-0 out of 5 stars Very good seller
My textbook came only three days after I placed the order. Very fast and decent description of the product that accidently left out the detail of the glued cover of the product. Nevertheless, no complaints from me other than I was wondering why the seller never included a tracking number on the shipment. Thank you very much Jolly Ranger.

1-0 out of 5 stars Not for entry level Stats
I think this is a great text if you already know the material. I had to purchase for a required Stats 1600, entry level, class. It seems like the focus of this text is to confuse the student rather than educate. By midterm I found a Stats tutor and even he had trouble following the text and was amazed how the authors complicated relatively simple material. If possible try and avoid this text and Professors PLEASE stop using this text in your Stats classes!

3-0 out of 5 stars Ok, Bordering on Good

This book is suitable for an introductory course in probability and statistics.That's about it.Heaven help you if you are using this book in a more advanced course because the problems don't come close to preparing you for the storm of pain some professors can inflict.

The book does a good job summarizing concepts and formulas.If you're expecting proofs, well, brace yourself for disappointment.If you fear proofs, then this book and you will get along swimmingly.

The biggest complaint is that there needs to be far more challenging homework problems.However, they do a great job of explaining how to use Minitab.

1-0 out of 5 stars Very poorly written
I am enrolled in my Masters in Statistics and Epidemiology. For my Epi I had to take an introductory stats class and though I have taken classes that are far more complex, I felt this book lacked organization and perhaps the worst statistics book I have ever had to read. Thus it received a one star.

3-0 out of 5 stars Did not use but looks good
Even though I didn't get to use this textbook it looked like a great intro to STATS. (That's why I gave it a 3 out of 5 stars). I took STATS in high school and the textbook was pretty old (written in the 90s or early 2000s). This one seemed as if it stuck to the needed material and took a step-by-step approach to introducing college students to the world of statistics. ... Read more


98. Probability and Statistics for Finance (Frank J. Fabozzi Series)
by Svetlozar T. Rachev, Markus Hoechstoetter, Frank J. Fabozzi CFA, Sergio M. Focardi
Hardcover: 654 Pages (2010-09-07)
list price: US$95.00 -- used & new: US$51.61
(price subject to change: see help)
Asin: 0470400935
Canada | United Kingdom | Germany | France | Japan
Editorial Review

Product Description
A comprehensive look at how probability and statistics is applied to the investment process

Finance has become increasingly more quantitative, drawing on techniques in probability and statistics that many finance practitioners have not had exposure to before. In order to keep up, you need a firm understanding of this discipline.
Probability and Statistics for Finance addresses this issue by showing you how to apply quantitative methods to portfolios, and in all matter of your practices, in a clear, concise manner. Informative and accessible, this guide starts off with the basics and builds to an intermediate level of mastery.
•    Outlines an array of topics in probability and statistics and how to apply them in the world of finance
•    Includes detailed discussions of descriptive statistics, basic probability theory, inductive statistics, and multivariate analysis
•    Offers real-world illustrations of the issues addressed throughout the text
The authors cover a wide range of topics in this book, which can be used by all finance professionals as well as students aspiring to enter the field of finance.

... Read more

99. Essentials of Medical Statistics
by Betty Kirkwood, Jonathan Sterne
Paperback: 512 Pages (2001-04-15)
list price: US$65.95 -- used & new: US$48.19
(price subject to change: see help)
Asin: 0865428719
Average Customer Review: 4.5 out of 5 stars
Canada | United Kingdom | Germany | France | Japan
Editorial Review

Product Description
Univ. of London, UK. Textbook presents statistics with clarity and provides comprehensive coverage of advanced and basic methods. Includes the most commonly used regression models and statistical methods. Emphasizes how to choose the appropriate methods for analysis and measures of association and impact. Expanded-outline format. Halftone line drawings. Previous edition: c1998. Softcover. ... Read more

Customer Reviews (7)

4-0 out of 5 stars Kirkwood's book is one of the best, but it is not a standalone book.
Medical Statistics 2nd ed. by Kirkwood and Sterne is a 501 page book printed on semi-glossy paper.There are six chapters and nine appendices.Essentially every page has a mathematical formula or a table of numbers.This is a good thing because it keeps the narratives concrete and firmly grounded.Only high school math is needed.

We learn about standard deviations, standard normal distributions, t distributions, Z statistic, t statistic, confidence intervals, hypothesis testing, p values, and more advanced formulas such as goodness of fit, Mandel-Haenszel methods, hazard ratio, Wilcoxon signed rank test, and Bayseian statistics.All of the examples concern clinical studies.This is in contrast to David Jones' excellent statistics book, where the many examples tend to concern manufacturing pills and vials.

Kirkwood's book and David Jones' book appear to be the best of the clinical statistics books, but neither is a standalone book.Both books suffer from the organizational problems that seem to characterized most books on clinical statistics.The reader will need to turn to Lange and to Durham to fill in various gaps.

I was specifically interested in understanding standard deviations, the Z statistic, the t statistic, p values, confidence intervals, alpha values, hazard ratios, Wilcoxon rank sum test, critical values, sample size and power calculations, hazard ratios, logrank statistics, and survival curves (Kaplan-Meier curves).

In setting out to understand these equations, bought and read:
(1) Dawson and Trapp (2004) Basic & Clinical Biostatistics (Lange Series);
(2) Durham and Turner (2008) Introduction to Statistics in Pharmaceutical Clinical Trials;
(3) Kirkwood and Sterne (2003) Medical Statistics;
(4) Motulsky (1995) Intuitive Biostatistics. In my opinion, Motulsky leaves the reader in a free-fall. On occasion, Motulsky provides some insight or guidance on using the various equations. But I would not recommend that any novice interested in statistics look first to Motulsky;
(5) Bart J. Harvey (2009) Statistics for Medical Writers and Editors. This tiny book is the best for understanding Standard Deviations. Harvey does not get much beyond SDs, and there is almost nothing about the t test or about p values;
(6) Rosner. Fundamentals of Statistics.

Providing that you have all four of these books -- (1) Jones, (2) Kirkwood, (3) Lange, and (4) Dawson, it is possible to learn statistics for clinical trials.The following compares the Jones, Kirkwood, Lange, and Dawson.

KAPLAN-MEIER PLOTS (survival plots). Kirkwood (pages 272-286) discloses survival plots.Jones fails to disclose Kaplan-Meier curves. For this topic, I refer the reader to the excellent discussion in Dawson & Turner.But Lange (pages 221-244) is by far the best for this topic.

SAMPLE SIZE AND POWER CALCULATIONS. Kirkwood (pages 417-418) is the best of the books for sample size calculations, as Kirkwood provides a straightforward formula. Jones discloses sample size and power calculations on pages 172-179. The Jones narrative seems to come to a dead end on page 175, where delta is revealed as equaling 2.5 mL. But according to my calculations, delta should be 1.2 mL (50-48.8=1.2 mL). Lange (page 127) seems to lead to a dead end (since Lange fails to explain where the number -0.84 comes from).

FORMULA for CONFIDENCE INTERVAL FOR LARGE SAMPLES.Pages 60-63 of Kirkwood covers this topic, while pages 135-141 of Jones covers this topic.For two different treatments (study drug group and placebo group), Kirkwood's coverage is on page 67-70, and Jones' coverage is on pages 141-144.

FORMULA for CONFIDENCE INTERVAL FOR SMALL SAMPLES. Kirkwood's pages 53-55 is equivalent to pages 151-154 of Jones, for this simple formula. But Kirkwood's presentation of general information on Confidence Intervals (pages 50-53 of Kirkwood) is far superior to any presentation in Jones on this particular topic. Hence, I would recommend readers consult both Jones and Kirkwood for this formula.

FORMULA for HYPOTHESIS TESTING FOR LARGE SAMPLES.Kirkwood's treatment is on page 46-49, and 69, while Jones's treatment is on pages 87-125.Kirkwood has only two examples, but Jones has seven examples. In this respect, Jones is much better than Kirkwood.Both books teach us that once we have calculated the Z statistic, there are two things we can do with it.First, we can plug it into a table of STANDARD NORMAL DISTRIBUTION and get the P value (a probability).Second, we can compare it with a standard number, e.g., "1.96" for use in hypothesis testing, that is, for getting a yes/no answer (page 157-159 of Jones, page 244 of Rosner).To writethis commentary, I needed to piece together information from several books.None of the books provides an organized stand-alone account of this formula.

FORMULA for HYPOTHESIS TESTING FOR SMALL SAMPLES.Kirkwood's treatment is on page 66, while Jones' treatment is on pages 168-178.These books teach that once we have the t statistic, there are two things we can do with it.First, we can plug it into a table (Table A4 of Kirwood) to obtain a P value, and get a probability.Second, we can cmparit it to the "critical value of the t deistribution" for hypothesis testing, and get a yes/no answer (Lange, page 101, 107).To writethis commentary, I needed to piece together information from several books.None of the books provides an organized stand-alone account of this formula.

DISORGANIZATION. A fault with all of the above statistics books is their disorganization. The reader would have an easier time if the authors would devote one page to disclosing that statistics requires making one's way through a decision tree. There are four yes/no questions in this decision tree. These four yes/no questions are independent of each other (see below).Following this, there are two more branches, dependent on earlier branches.

(1) Are you interested in CI, or are you interested in hypothesis testing?
(2) Is your sample from a large group, e.g., 60 data points or more (then you should use Z statistic) or is your sample a small group, e.g., under 60 data points (then you use t statistic).
(3) Are you comparing one sample mean with a population mean? Or does your comparison involve a "paired measurement," that is, data from a STUDY DRUG GROUP and data from CONTROL GROUP, where you compare [sample mean#1 minus sample mean#2] with [population mean#1 minus population mean#2]?
(4) Does your experimental setup involved a 1-tailed experiment, or does your experimental setup involve a 2-tailed experiment?

Then, there are three additional yes/no decisions to make in the decision tree:

FIRST DECISION. If you are working with the t statistic, you can use it to acquire a P value (page 66, Kirkwood) or you can use it for comparing with the "critical value of the t statistic, for use in hypothesis testing (page 63, Kirkwood; page 140-141, Lange). To repeat, once you have a value for the "t statistic," you can use this value for two different purposes: (1) PLUG IT INTO A TABLE TO GET A P VALUE; or (2) COMPARE IT WITH THE CRITICAL VALUE OF THE t STATISTIC TO DO HYPOTHESIS TESTING.

SECOND DECISION. If you are working with the Z statistic, you can use it to acquire a P value (page 92, Jones), or you can use it to do hypothesis testing (pages 157-159 of Jones, page 244 of Rosner, page 141 of Lange). To repeat, once you have a value for the "Z statistic," you can use this value for two different purposes: (1) PLUG IT INTO A TABLE TO GET A P VALUE; or (2) COMPARE IT WITH THE CRITICAL VALUE OF THE NORMAL DISTRIBUTION TO DO HYPOTHESIS TESTING.

THIRD DECISION.If you are working with the Z statistic, you need to decide between two formulas.Z = [X-u]/[SD] (FIRST FORMULA); and Z = [X-u] / [(SD)/(square root of n)] (SECOND FORMULA).

The question is, when do you use the FIRST FORMULA and when do you use the SECOND FORMULA?Kirkwood fails to address this question.But Jones in combination with Lange provides excellent guidance as to when to use the FIRST FORMULA and when to use the SECOND FORMULA.For use of the FIRST FORMULA, see Jones pages 87-89 and Lange page 87.For use of the SECOND FORMULA, see Jones pages 156-159, and Lange pages 85-86.In a nutshell, the FIRST FORMULA is used for comparing data from a mean with a hypothetical value of interest to you (a value that you dreamed up out of thin air).The SECOND FORMULA is used when numbers are available for a Population Mean (and Population SD), and where numbers are available for a Sample Mean, and where your goal is to find probability of a hypothetic sample mean will have a value that is higher than (or lower than) the value of the sample mean.Jones does a better job at distinguishing between the two formulas than does Lange.Jones comes to the rescue!

The above collection of decisions in the decision tree is inherent in all of the statistics books, including Kirkwood, but the books fail to make explicit the fact that these decisions are what statistics is about. In my opinion, there is no excuse for this sort of obscurity and disorganization that so characterizes statistics books. It does not have to be this way.

The formulas used for clinical statistics have been around for over 100 years. The mathematics used in these books is on the level of a college freshman. Why is it that the presentation of statistics in all of these books, including Kirkwood's book, is so disorganized, disjointed, and sporadic? These formulas are not rocket science. There is no excuse for generally uneven quality of the available statistics books.

Kirkwood is further confusing when a specific symbol in a formula needs a subscript.What is confusing is that Kirkwood fails to print the subscript-worthy symbol as a subscript.The consequence is that the reader might think that the first symbol needs to be multiplied by the second subscript-worthy symbol.What a CONFUSING MESS this is!Kirkwood's confusing mess can be found, for example, on pages 148-164.We read about "s.c.(p1-po)."But the (p1-po), or in other formulas the (p1), which occur in the part of a formula to the left of the equal sign (and also in parts of a formula to the right of an equal sign) is not properly subscripted.Mess, MESS, MESSSSSSSSS.Fortunately, Lange comes to the rescue.Lange properly shows subscripted subscripts on pages 137 and 147 of Lange. Thank you, Lange! This is not rocket science, gang.Subscripting is what we learn in middle school math. There is no excuse for this time-wasting, confusing, way of writing statistics books.

Actually, Lange does provide a DECISION TREE for determining which statistics formula to use.This DECISION TREE is located on the inside front cover, but it does not come with any written commentary.Lange has the right idea, as far as efficacy in statistics teaching is concerned.Once again, hurray for Lange.

4-0 out of 5 stars Generally accurate, but simplistic on small data set analysis
I found the book fairly accurate, but compared with Alvan Feinstein's Principles of Medical Statistics, it overly simplified many tests. The section on use of Yates correction for Chi Square tests is an example. It quotes Cochran's book from the 1950s, but ignores more recent analysis of the issues. The section on Fisher Exact test states categorically that this cannot be used for anything other than 2x2 tables, but Fisher extended his test with the Fisher-Freeman-Halton Test for larger tables. With the increased use of computer simulations and Monte Carlo methods, it would have been helpful to discuss this type of analysis. I also found that it was not particularly well organized in differentiating analysis of nominal and ordinal data. However, it covers the basic tests well and is correct in promoting confidence intervals over simple p-value significance testing. One area that stands out in this book compared to similar other books was suggestions for transformations of data for skewed data.

5-0 out of 5 stars Excellent Text
This is an excellent reference. Almost all of the methods used in published clinical trials are discussed. The presentation is clear with sufficient detail to enable the reader implement the methods described. Worked examples are clear and to the point. Appendix tables that group analysis methods according to their use are very helpful. Charles Mayo, Ph.D.

5-0 out of 5 stars I am very satisfied with this book
I purchased this book to help understand medical statistics as used in medical journal articles and to help understand their use for my own articles. I still intend to use the aid of a trained biostatistician for data evaluation; however, this book has helped me better to understand what all the tests mean.The book is easy to read and each chapter builds logically on the chapter before.I would highly recommend it to physicians who have similar needs.I see the book will be coming out in 2009 under a slightly different title?I guess that is a positive sign of the popularity of this book.

5-0 out of 5 stars Perfect
This is simply a great stats book.It takes complex models such as logistic regression and multivariate analysis and explains them in real life simple examples.I feel that I finally have a grasp on medical statistics and how and when to use these test. ... Read more


100. MBA Fundamentals Statistics (Kaplan MBA Fundamentals)
by Paul W Thurman
Paperback: 288 Pages (2008-01-01)
list price: US$19.95 -- used & new: US$11.69
(price subject to change: see help)
Asin: 1427796599
Average Customer Review: 5.0 out of 5 stars
Canada | United Kingdom | Germany | France | Japan
Editorial Review

Product Description
In MBA Fundamentals in Statistics, readers learn to decipher and critically examine the information that is presented to them on a daily basis through polls, surveys, scientific studies, and more. Through real-life situations and simple exercises, anyone can learn to be a critical consumer of information and to make better business decisions. ... Read more

Customer Reviews (6)

5-0 out of 5 stars The BEST and the MOST useful textbook I read during my first semester
So far, this is the only book I read every page of during my first semester.

Highly recommended !!! And as said above, having a Professor Thurman as an instructor of the course is a privelege. It really is!

The price is indeed surprising and he mentioned during the class that he agreed writing the book (which is actually the collection of his lecture notes) only if they made sure it was sold at a cheap price.

You'll only enjoy this book!

5-0 out of 5 stars Sheer Genius
This book is a must-have for any aspiring MBA student.In fact, it's a must have for any business manager who wants to make real world decisions in the face of uncertainty.

5-0 out of 5 stars Finally a good textbook. Is the price right?
As a student, do you always skip the statistics part when you read a scientific article and only read the end. Well, worry no more. This book really makes you learn.

I have the feeling that this book will be the next best-seller among MBA's after Graham and Dodd's Book on Value Investing.

I still can't believe this book is on the market with this price. It makes me feel I have been robbed when I spent $100 on all other big text books that I barely read a chapter.


5-0 out of 5 stars Fantastic Stats Professor
I had the priviledge to study statistics with Professor Paul Thurman at Columbia University.I can honestly say he was one of the best professors I encountered at Columbia.He can teach a blind bat how to work on stata, I know because I was the equivilant of a blind bat in statistics.His course helped me learn how to use statistics in a practical manner-- helping me see the importance of stats in every day life.While not everyone has the luxury of having Professor Thurman as their professor, they can now have the next best thing, this book.

5-0 out of 5 stars The Goldilocks of Intro Stats Books
I teach MBA students and they often ask about a good intro to statistics. I have looked at many intro level books in the past, and most were either much too basic or assumed too much background knowledge. Thurman's book is really the Goldilocks text -- not too basic, not too complicated, just right for new MBA students. ... Read more


  Back | 81-100 of 100
A  B  C  D  E  F  G  H  I  J  K  L  M  N  O  P  Q  R  S  T  U  V  W  X  Y  Z  

Prices listed on this site are subject to change without notice.
Questions on ordering or shipping? click here for help.

site stats